
Project Description
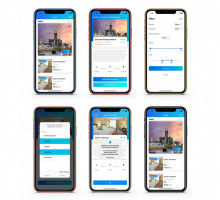
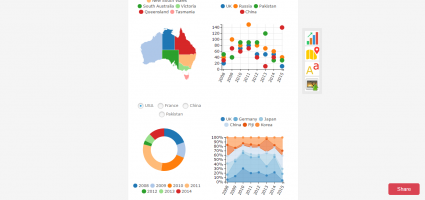
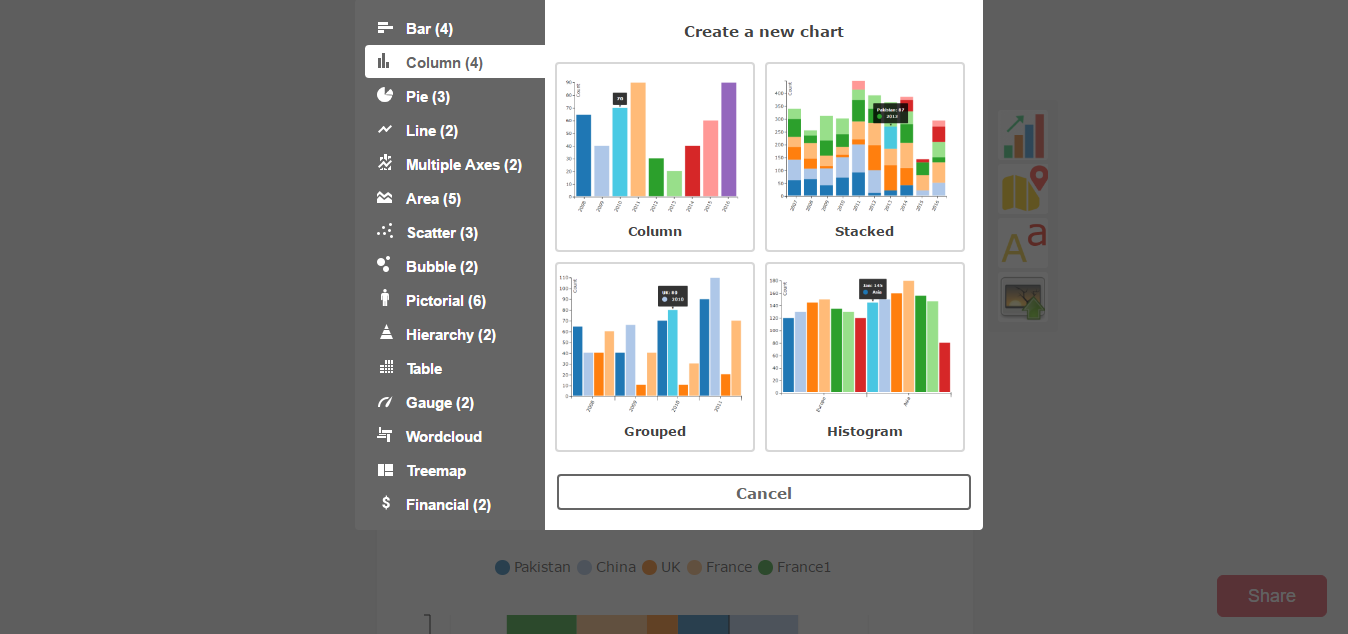
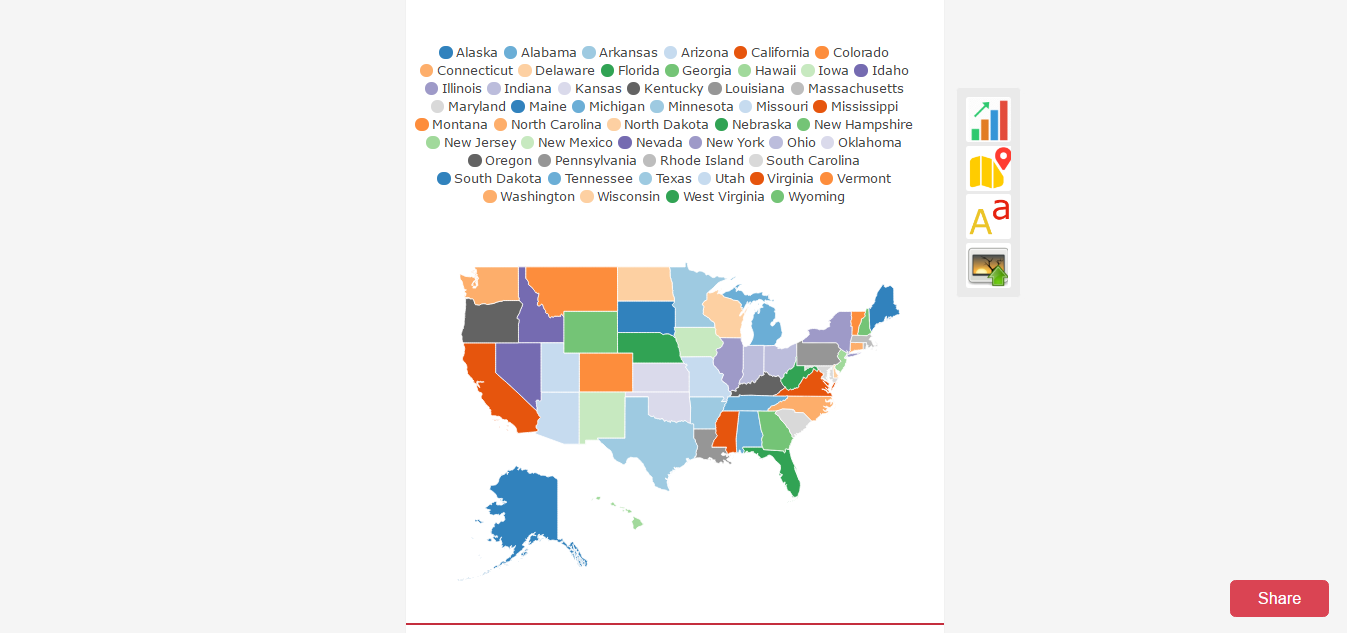
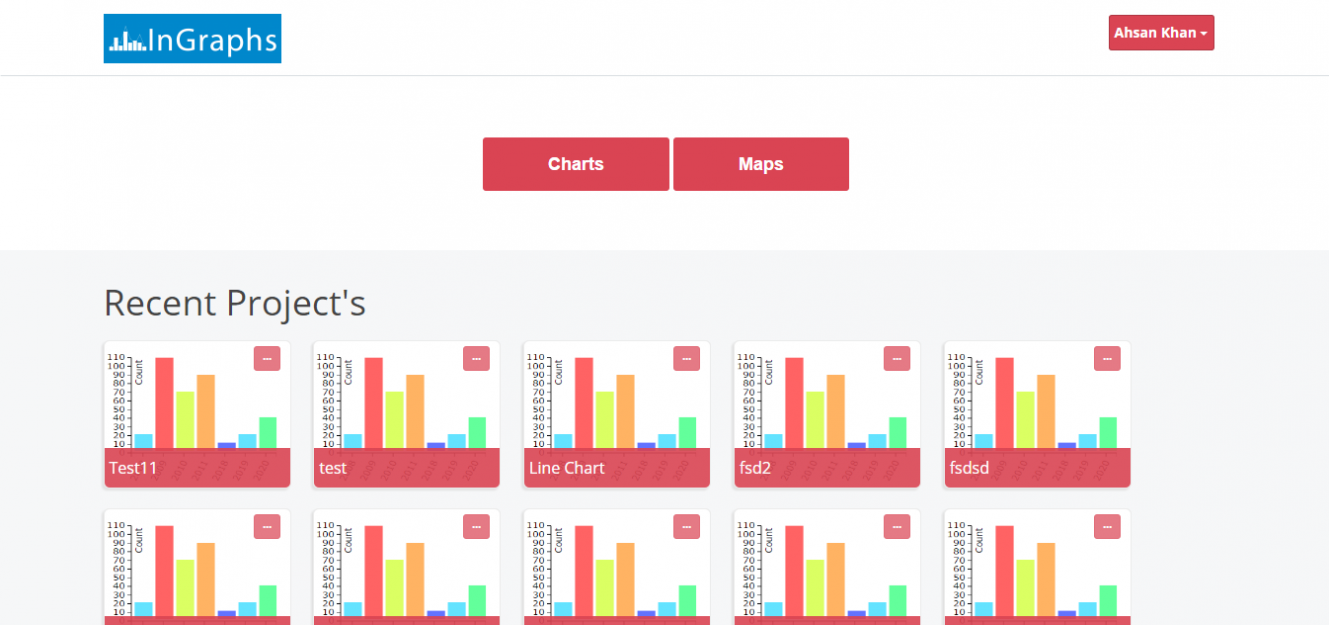
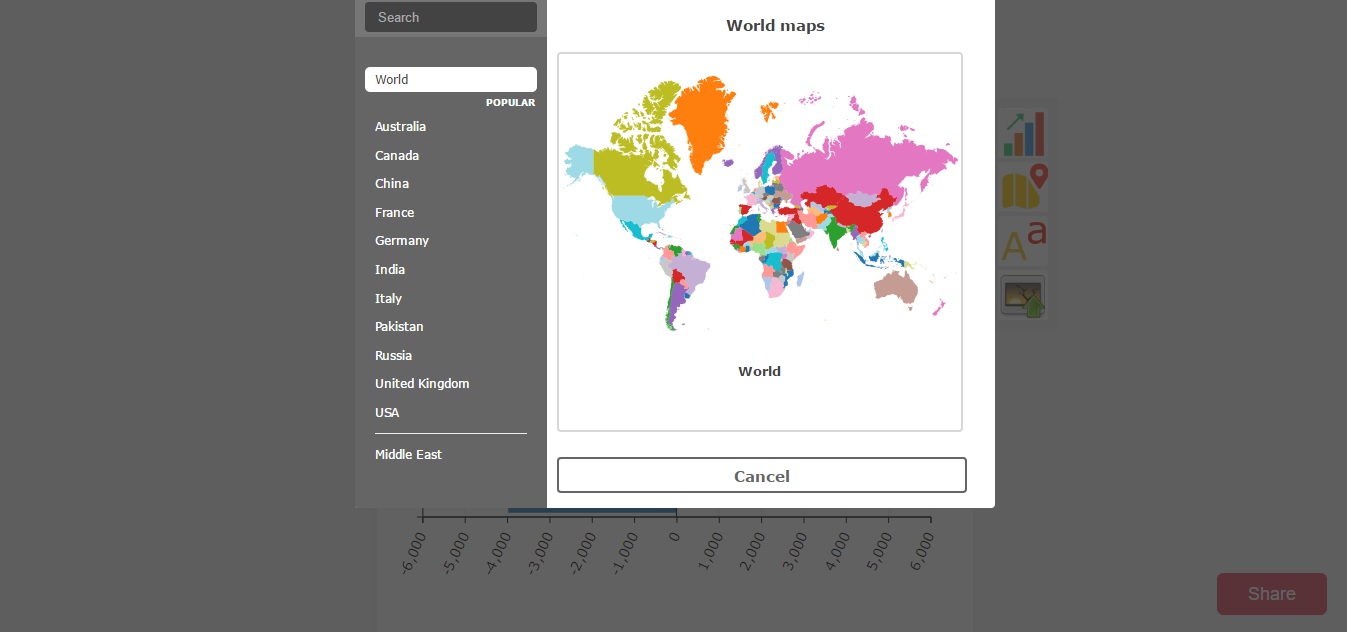
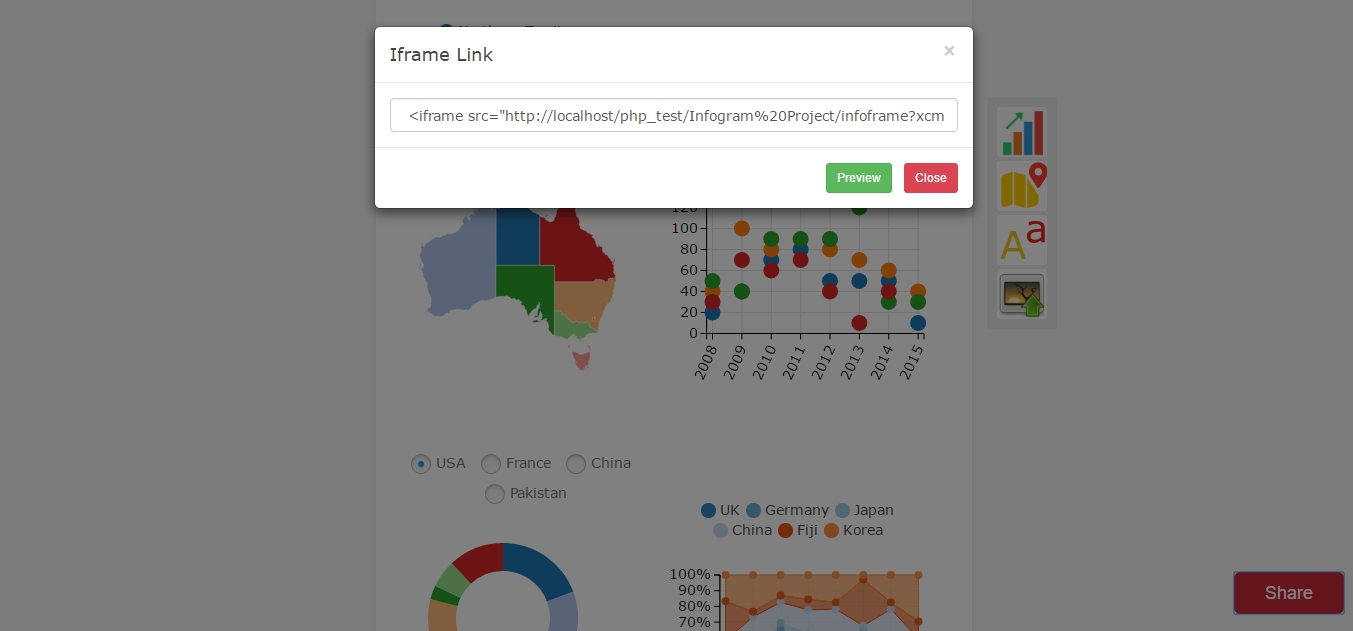
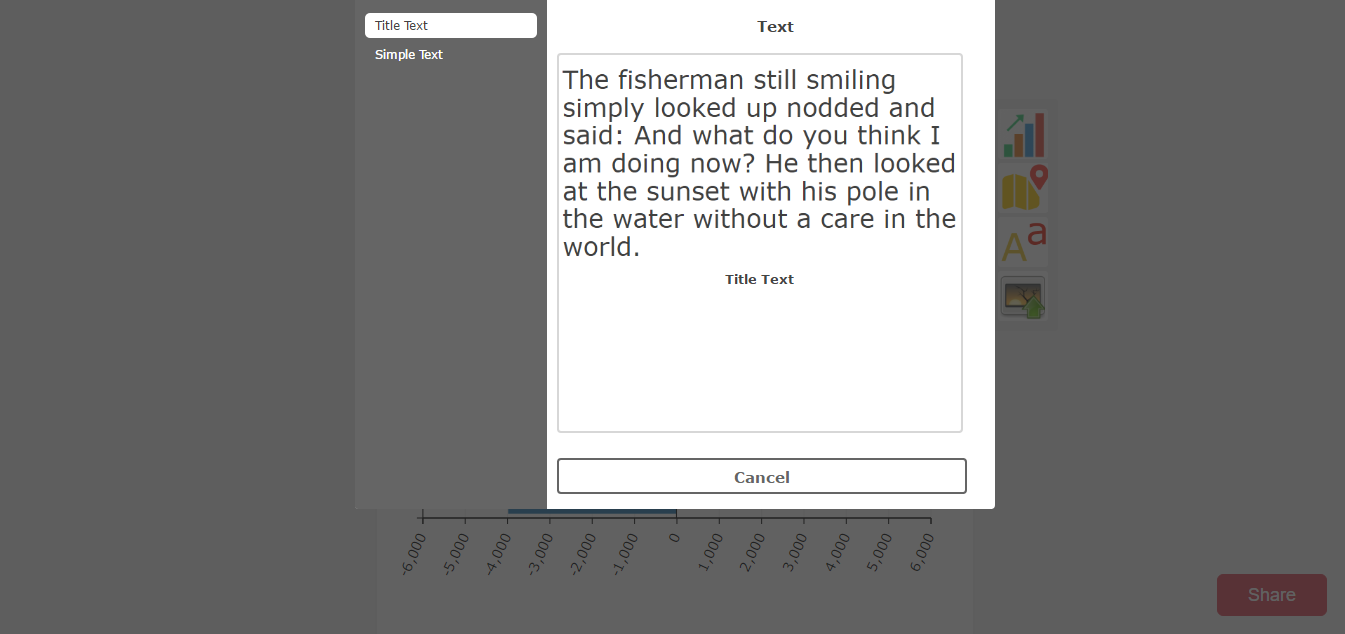
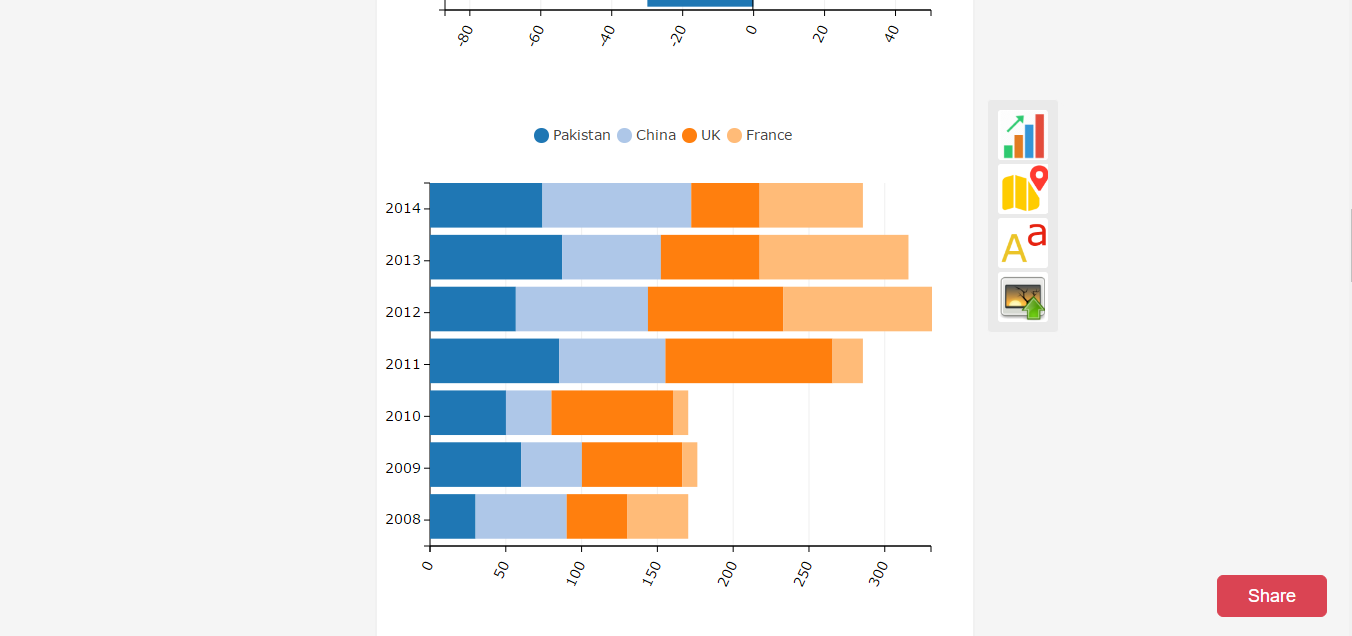
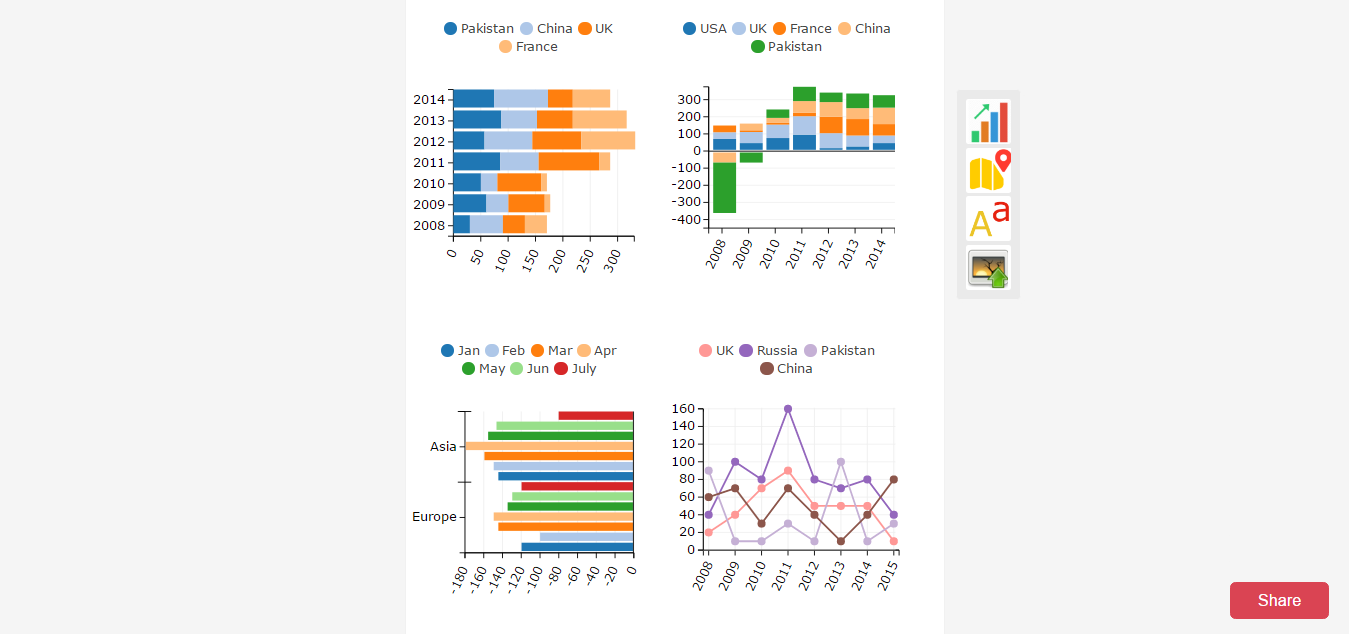
InGraphs is a data visualizing website. We have made all type of graphs, interactive maps and texts with image uploading and resizing functionality for InGraphs website. User can create different types charts and maps and show his data in the form of any suitable graph or map. InGraphs have many other 100's of things. Go to inGraphs.com to explore our work.Project Details
- Country: Italy